Winter 2019 Math 10 Final Project Kaggle in-class Competition
In the course project, groups of three students will work together to create regression/classifiers for an in-class Kaggle prediction competition. The competition training data is available from the UCI Math10 Kaggle in-class competition webpage. Please register your Kaggle account as early as possible.
The Dataset
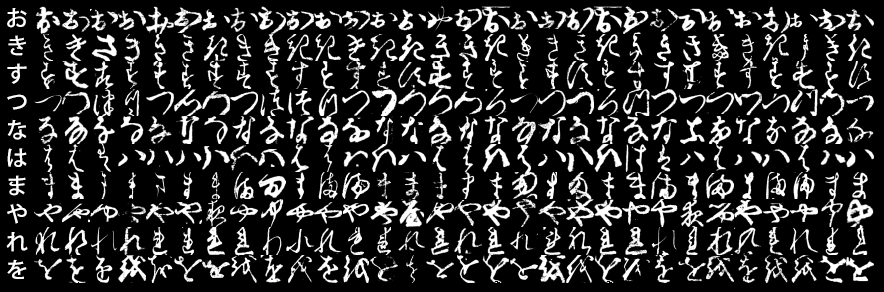
Our competition data on Kaggle are an MNIST replacement, which consists of Japanese characters, and contains the following 2 dataset:
- Kuzushiji-MNIST is a drop-in replacement for the MNIST dataset (28×28 grayscale, 70,000 images), provided in the original MNIST format as well as a numpy format. Since MNIST restricts us to 10 classes, we chose one character to represent each of the 10 rows of Hiragana when creating Kuzushiji-MNIST.
The data are courtesy of Tarin Clanuwat, link on github.
Background: The MNIST database of handwritten digits, available from this page, has a training set of 60,000 examples, and a test set of 10,000 examples. It is currently the de facto benchmark dataset for any machine learning models (classification, neural net, clustering). The K-MNIST we will use are datasets formatted similar, but with different values and has far more features, which means if you use existing trained models for MNIST on this directly, and you have to “re-tune” the hyperparameters and “re-train” the parameters for your models.
The Evaluation
Scoring of predictions is done using a simple measure:
\[\displaystyle \frac{1}{n_{\text{test}}}\sum_{i=1}^{n_{\text{test}}} \frac{ |y^{(i)}\cap h(\bf{x}^{(i)})| }{ |h(\bf{x}^{(i)})| }\]where $y^{(i)}$ is the actual label of the i-th data sample, $h(\bf{x}^{(i)})$ is the your classifier’s predicted label for testing data sample $\bf{x}^{(i)}$. This basically computes the ratio of how much of the predicted is correct.
The Classification Problem and How to Use Kaggle
Download
kmnist-train-imgs.npz, kmnist-train-labels.npz, kmnist-test-imgs-perm.npz,
from our Kaggle competition site. The npz file format will be directly readable by numpy by the starter code on Github. You will build a classifier using the training data of K-MNIST (first two files), make predictions based on the test file (the third file), and upload your predictions in csv file format to Kaggle for evaluation.
Kaggle will then score your predictions, and report your performance on a random subset of the test data to place your team on the public leaderboard. After the competition, the score on the remainder of the test data will be used to determine your final standing; this ensures that your scores are not affected by overfitting to the leaderboard data.
Kaggle will limit you to at most 2 uploads per day, so you cannot simply upload every possible classifier and check their leaderboard quality.
You will need to do your own cross validation based on the training data. To be specific, on Kaggle data page, Y_solution_orig.csv contains the labels of the original dataset, however, the testing data kmnist-test-imgs-perm.npz is shuffled randomly so that it does not match this original solution anymore, i.e., the labels of each testing sample are unknown! If you use Y_solution_orig.csv as your label for testing/cross-validation, your accuracy can only get as good as 10%. Instead, we should make good use the labeled data, i.e., the 60000 images and labels. Split the data into training and cross-validation sets. Use training dataset to train a model, use the cross-validation set to make sure the model is not overfitting/underfitting, and then upload your besting model’s prediction on Kaggle for scoring. You can even try splitting the training data into multiple folds, to tune the parameters of learning algorithms before uploading predictions for your top models.
The competition closes (uploads will no longer be accepted or scored) on March 22nd, 2019 at 11:59pm Pacific daylight-saving time.
Submission Format
Your submission must be a csv file containing two columns separated by a comma, and this file generation is in a cell of the starter code on Github. The first column should be the instance number (a positive integer), and the second column is the class for that instance (the highest probable class predicted by your model). The first line of the file should be “ID, class ”, the name of the two columns. We will have a sample submission file, containing random predictions, named kmnist-test-random.csv.
Forming a Project Team
Students will work in teams of up to three students to complete the project. Please go to Canvas People tab to sign up teams. If you have not joined a team by the end of Week 8, you will be randomly assigned to a team.
Project Requirements
Each project team will learn several different classifiers for the Kaggle data, to try to predict class labels as accurately as possible. We expect you to experiment with at different types of classification models, or combine two of them. Suggestions include:
-
K-Nearest Neighbors. KNN models for this data will need to overcome two issues: the large number of training & test examples, and the data dimension. As noted in class, distance-based methods often do not work well in high dimensions, so you may need to perform some kind of feature generation/selection or data augmentation to decide which features are most important. Also, computing distances between all pairs of training and test instances may be too slow; you may need to reduce the number of training examples somehow, or use more efficient algorithms to find nearest neighbors. Finally, the right “distance” for prediction may not be Euclidean in the original feature scaling (these are raw numbers); you may want to experiment with scaling features differently, or use tree-based search algorithm.
-
Linear models: We can use the softmax regression for multi-classes classification. However, we have a large amount of training data, a simple linear model may not be very efficient.
-
Support Vector Machines (optional): SVM is like KNN classifiers, and some data pre-processing or subsampling may be required.
-
Random Forest (optional): RF classifier is a tree-based machine learning algorithm.
-
Gradient Boosting (optional): an upgraded version of RF where weaker learners are combined to make a good classifier.
-
Neural networks. The key to learning a good NN model on these data will be to ensure that your training algorithm does not become trapped in poor local optima. You should monitor its performance across backpropagation iterations on training/validation data, and verify that predictive performance improves to reasonable values. Start with few hidden layers (1-2) and moderate numbers of hidden nodes (100-1000) per layer, and verify improvements over baseline linear models (softmax regression).
-
Other. You tell us! Apply another class of learners, or a variant or combination of methods like the above. You can use existing libraries or modify the course codes. The only requirement is that you understand the model you are applying, and can clearly explain its properties/advantages in the project report. If you simply copied the code from elsewhere without explanation of its advantages/what it does, your points will be lower than you simply applying the methods you learned in class (softmax/neural nets+kfold CV).
For each machine learning algorithm, you should do enough work to make sure that it achieves “reasonable” performance, with accuracy similar to (or better than) the benchmark baselines like (1) softmax regression for the 10 classes, which scores 89% on the leaderboard, (2) KNN with several neighbors which scores 91.7% on the leaderboard in the starter code. Then, take your best learned models, and combine them using a blending or stacking technique. This could be done via a simple average/vote, or a weighted vote based on another learning algorithm (ensemble). Feel free to experiment and see what performance gains are possible.
Project Report
By March 22nd, 2019, each team must submit a single 2-page pdf document together with your .ipynb notebook or .py file describing your classifiers. Please include:
- A table listing each model, as well as your best models (or blended/ensembled models), and their performance on training and validation and public leaderboard data.
- For each model, use a short paragraph or two describing: what data you gave it (raw inputs, selected inputs, etc.); how was it trained (learning algorithm and software source); how was it cross-validated; and key hyperparameter settings (learning rate, regularization, plus your approach to choosing those settings).
- fA conclusion paragraph highlighting the methods/algorithms that you think worked particularly well for this data, the methods/algorithms that worked poorly, and your hypotheses as to why.
Your project grade will be mostly based on the quality of your written report, and groups whose final prediction accuracy is mediocre may still receive a very high grade, if their results are described and analyzed carefully. But, some additional points will also be given to the teams at the top of the leaderboard.
To check the current leaderboard: please visit https://www.kaggle.com/c/uci-math-10-winter2019/leaderboard
Comments